Image

Description
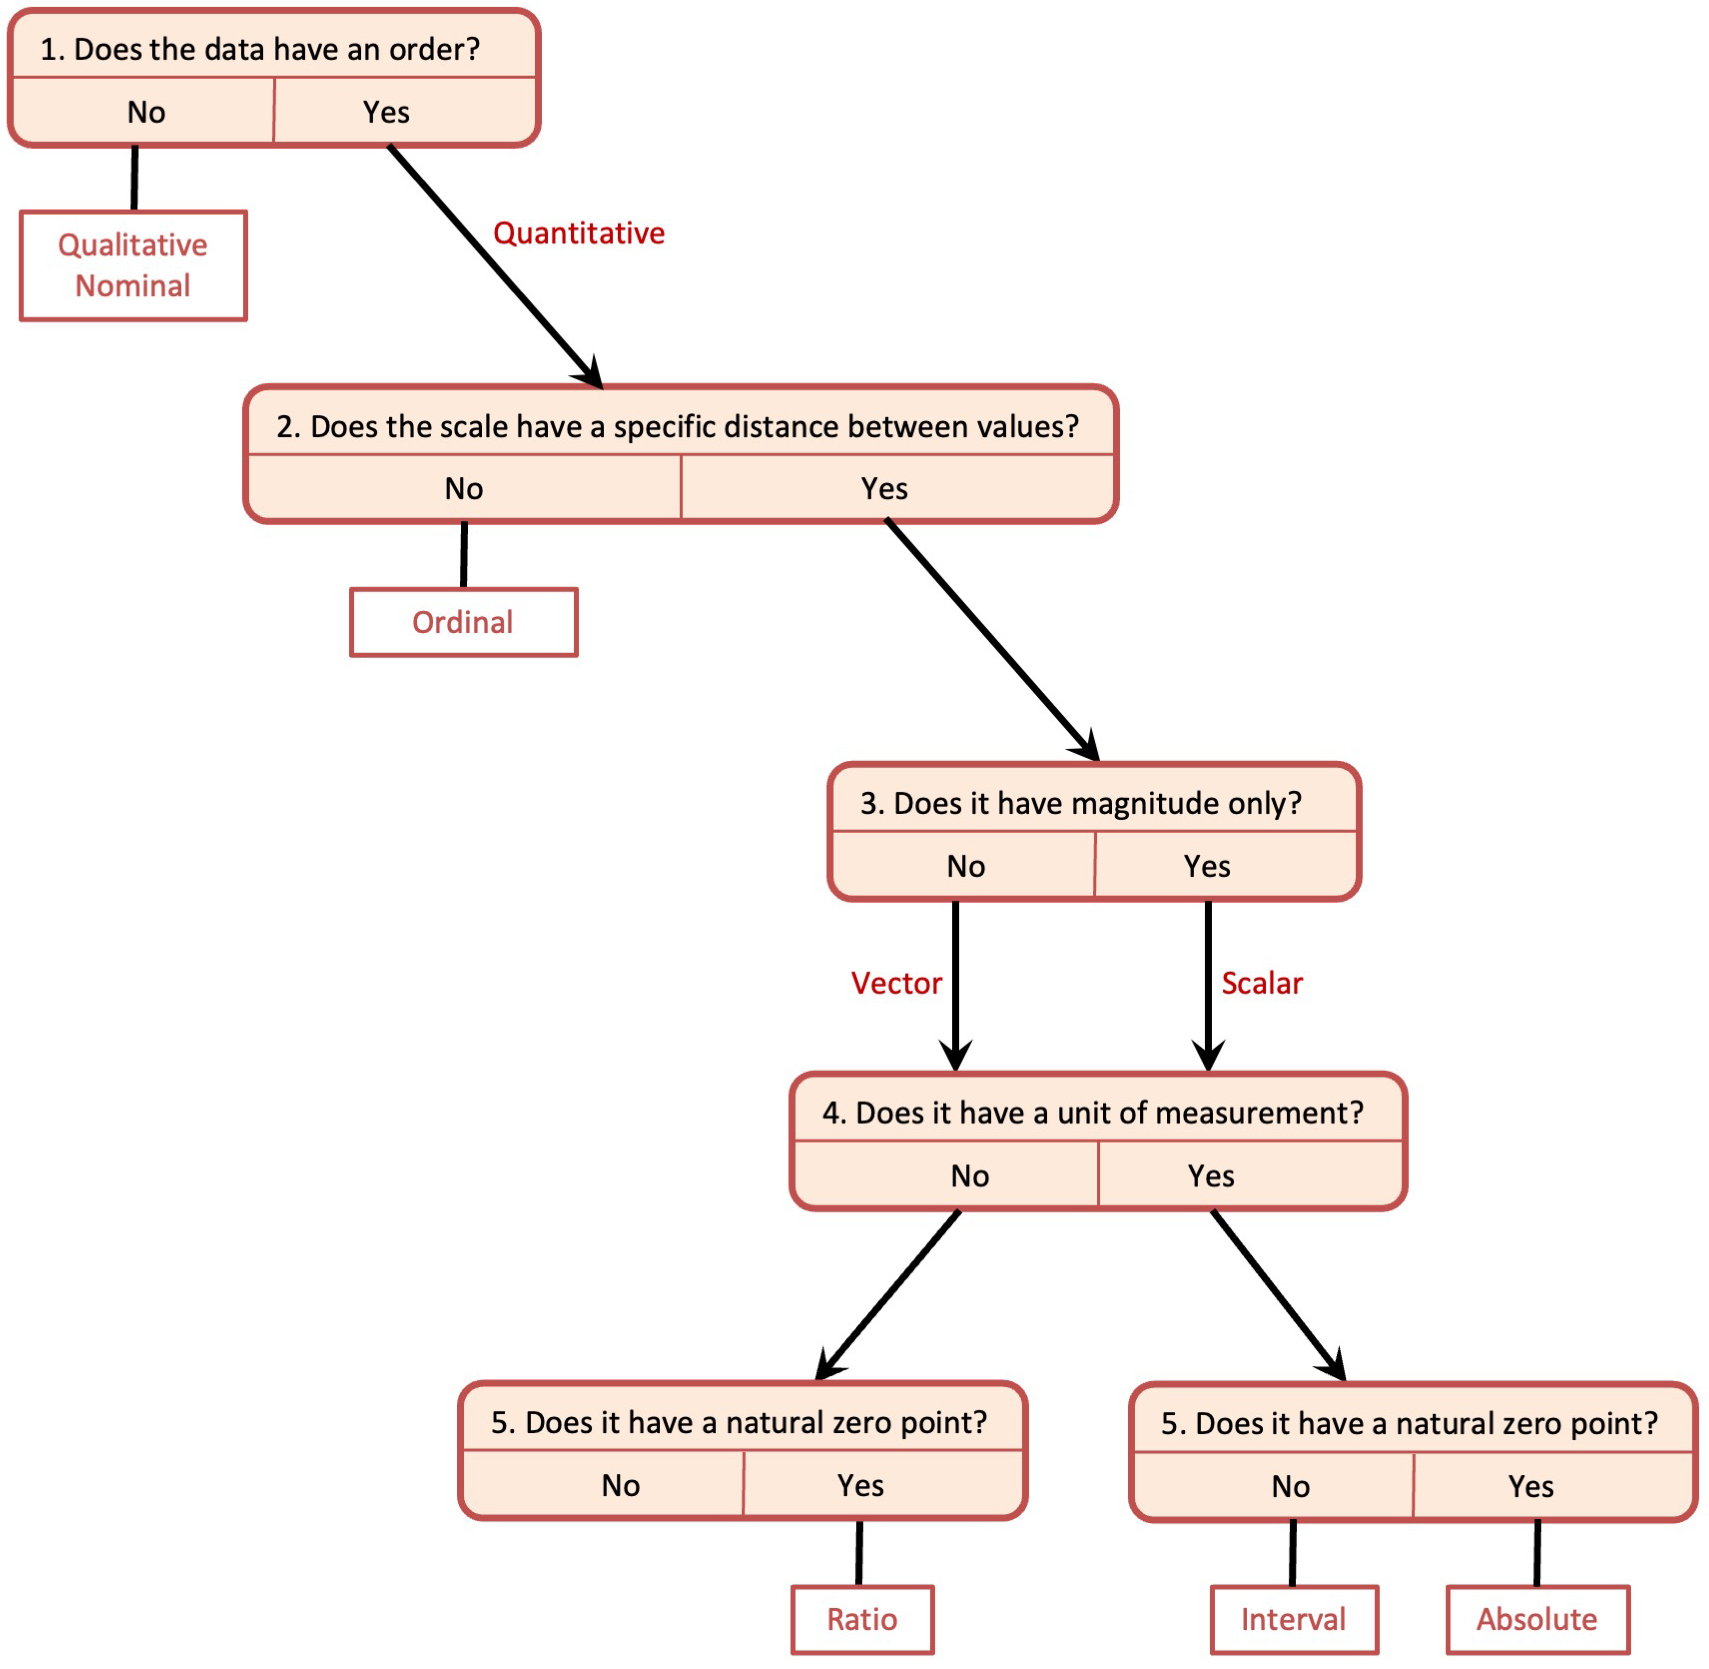
This flow chart is designed to help you determine what type of data you are interested in based on answers to a series of questions. You may also use the series of questions outlined below, where each stage of the flow chart is described by a numbered node with a question that leads to an answer or other nodes:
Node 1
Does the data have an order?
If no, the data type is Qualitative Nominal
If yes, go to Node 2
Node 2
Does the scale have a specific distance between values?
If no, the data type is Ordinal
If yes, go to Node 3
Node 3
Does it have magnitude only?
If no, it is a vector, go to Node 4
If yes, it is a scalar, go to Node 4
Node 4
Does it have a unit of measurement?
If no, go to Node 5a
If yes, go to Node 5b
Node 5a
Does it have a natural zero point?
If yes, it is a Ratio
Node 5b
Does it have a natural zero point?
If no, it is an Interval
If yes, it is Absolute